Ticket Analytics
Track support tickets by volume, status, priority, category, resolution time and SLA compliance to uncover workload trends and improve efficiency.
The Ticket Analytics dashboard provides administrators and support managers with a comprehensive overview of ticket activity across the platform. It tracks all support conversations generated through connected communication channels, including product issues, billing inquiries, and general customer feedback.
This dashboard helps teams monitor support performance, identify workload distribution, and measure operational efficiency.
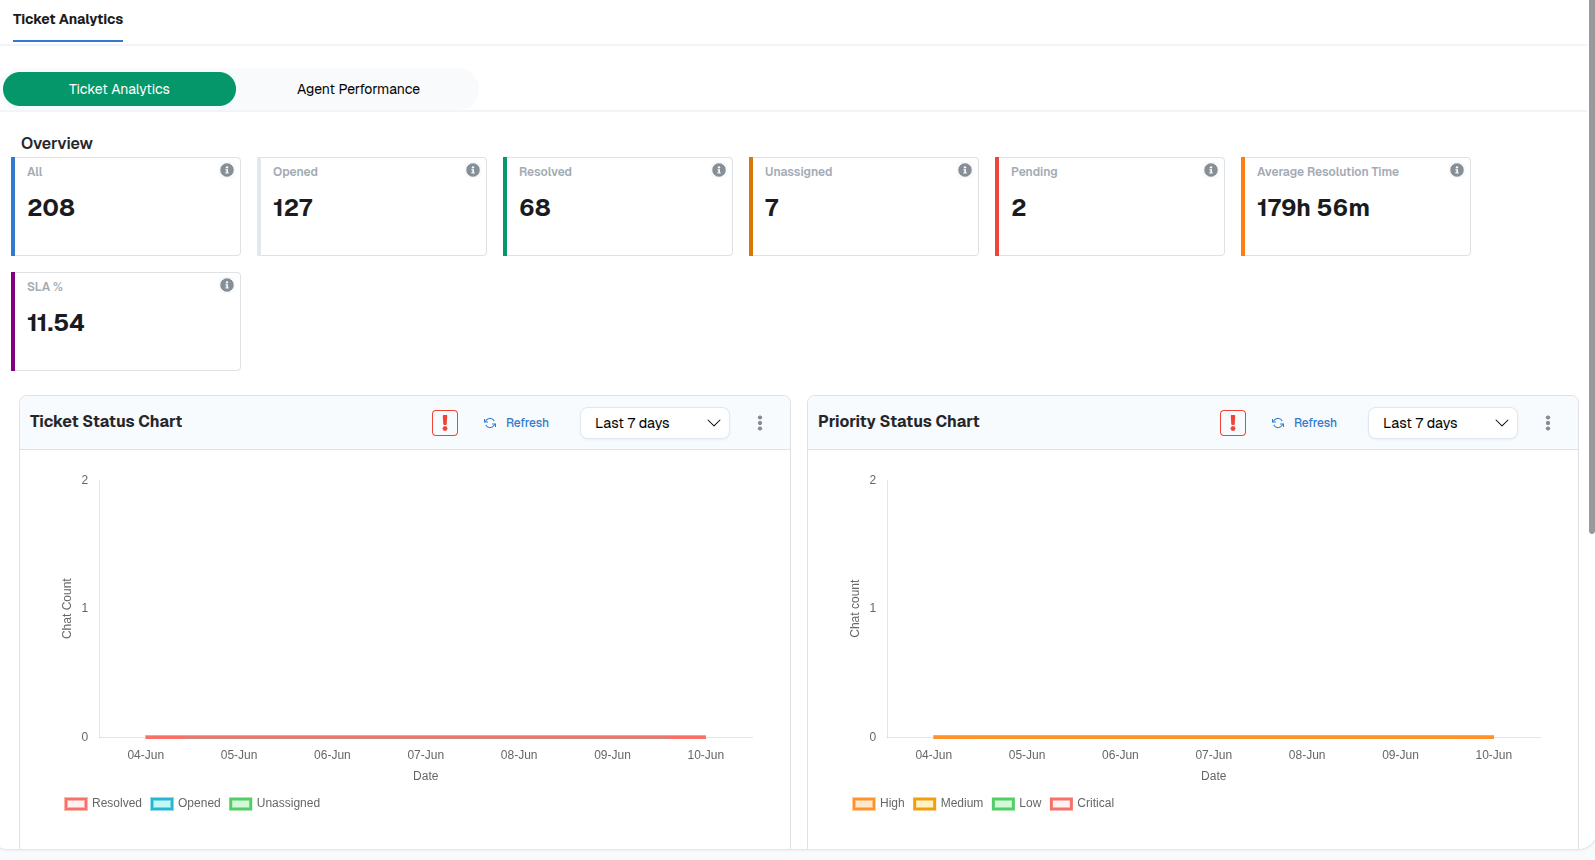
Accessing Ticket Analytics:
To open the Ticket Analytics dashboard:
Navigate to the left-side menu in the Chat360 platform.
Click Analytics.
Select Support Desk.
The Ticket Analytics tab will open by default, displaying key ticket metrics and visual reports.
Key Performance Metrics
The dashboard displays several summary metrics that provide insights into ticket performance.
Total Tickets: Displays the total number of tickets created within the selected date range.
Opened Tickets: Shows the number of tickets that are currently active and still being worked on by support agents.
Resolved Tickets: Indicates the number of tickets that have been successfully closed after resolving the customer’s issue.
Unassigned Tickets: Highlights tickets that have not yet been assigned to any support agent. This helps administrators quickly identify tickets waiting for allocation.
Pending Tickets: Represents tickets that are temporarily stalled or waiting for additional information or follow-up from the user.
Average Resolution Time: Shows the average time taken to resolve tickets, helping teams measure support efficiency.
SLA Percentage (Service Level Agreement): Displays the percentage of tickets resolved within the defined response or resolution time commitments.
All metrics update dynamically based on the selected date range, which can be customized (for example, Last 7 Days, Last 30 Days, or a custom period).
Visual Analytics
In addition to summary metrics, the dashboard includes graphical reports that help visualize ticket activity.
1.Ticket Status Chart
This chart displays the distribution of tickets based on their status, such as:
Opened
Resolved
Unassigned
It helps teams monitor how tickets move through the support lifecycle over time.
2. Priority Status Chart
The Priority Status Chart categorizes tickets based on urgency levels, including:
Critical
High
Medium
Low
This helps support managers understand how issues are prioritized and identify urgent cases that require immediate attention.
3. Category Status Chart
This chart shows the distribution of tickets across different support categories, such as:
Technical issues
Billing inquiries
Feature requests
General queries
By analyzing category trends, teams can identify common support issues and improve internal processes or product features accordingly.