NLU Engine Analytics
The NLU (Natural Language Understanding) Engine Analytics dashboard provides insights into how effectively the NLU layer interprets user inputs and generates responses. It tracks intent recognition performance, response
The NLU (Natural Language Understanding) Engine Analytics dashboard provides insights into how effectively the NLU layer interprets user inputs and generates responses. It tracks intent recognition performance, response quality metrics, and system performance indicators.
These insights help teams improve intent detection accuracy, optimize conversational models, and deliver more context-aware and reliable user interactions.
Accessing NLU Engine Analytics
To open the NLU Engine Analytics dashboard:
From the left sidebar, click Analytics.
Navigate to the NLU Engine tab at the top of the analytics page.
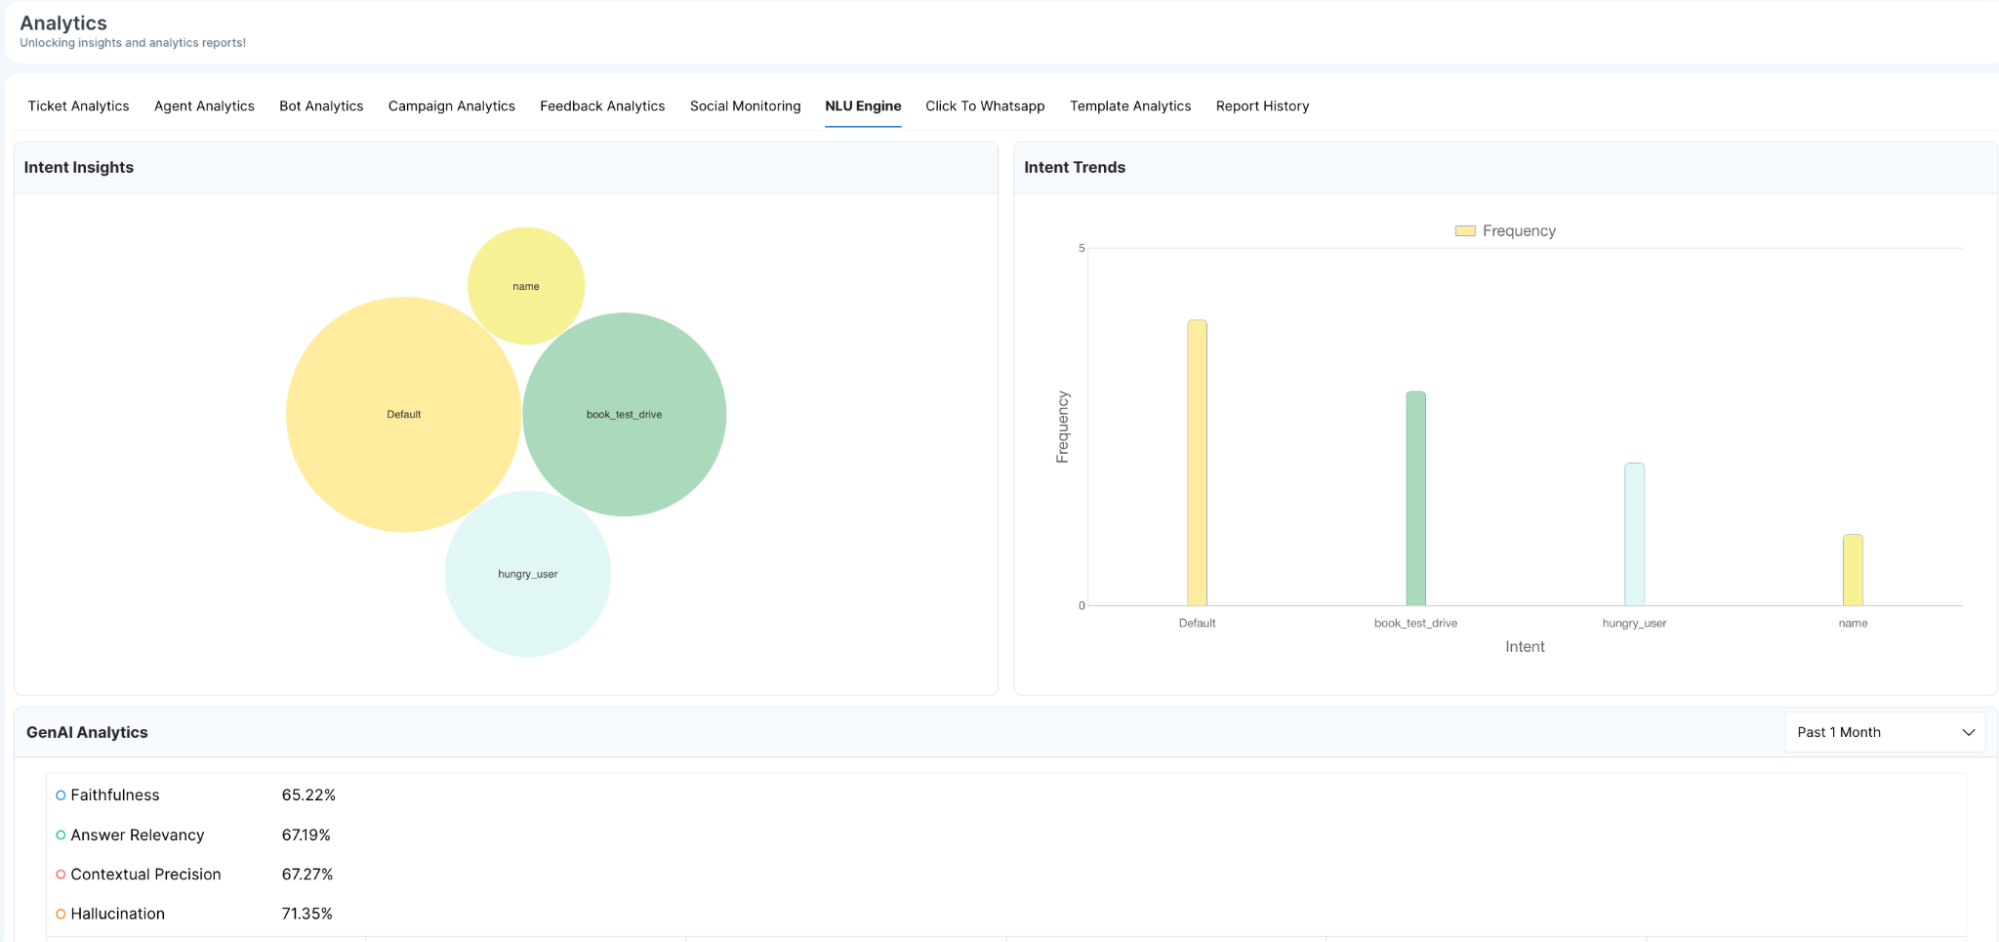
The dashboard will load with charts, performance metrics, and query logs related to NLU processing.
Key Sections
Intent Insights
The Intent Insights section displays a bubble chart showing which intents are detected by the NLU engine and how frequently they occur.
Bubbles: Each bubble represents a specific intent, such as
book_test_driveorhungry_user.Bubble Size: The size of the bubble increases based on how often the intent is detected within the selected time period.
Labels: Intent names are displayed alongside the bubbles, allowing quick identification of high-frequency intents.
This visualization helps teams quickly identify the most commonly triggered intents.
Intent Trends
The Intent Trends section includes a bar chart that tracks how frequently each intent is triggered.
X-Axis: Displays the list of detected intents.
Y-Axis: Shows the number of times each intent was triggered.
Bars: Vertical bars represent intent volume, making it easy to identify usage spikes or declines. Hovering over a bar reveals the exact count for that intent.
This chart helps track how user intent patterns change over time.
GenAI Analytics
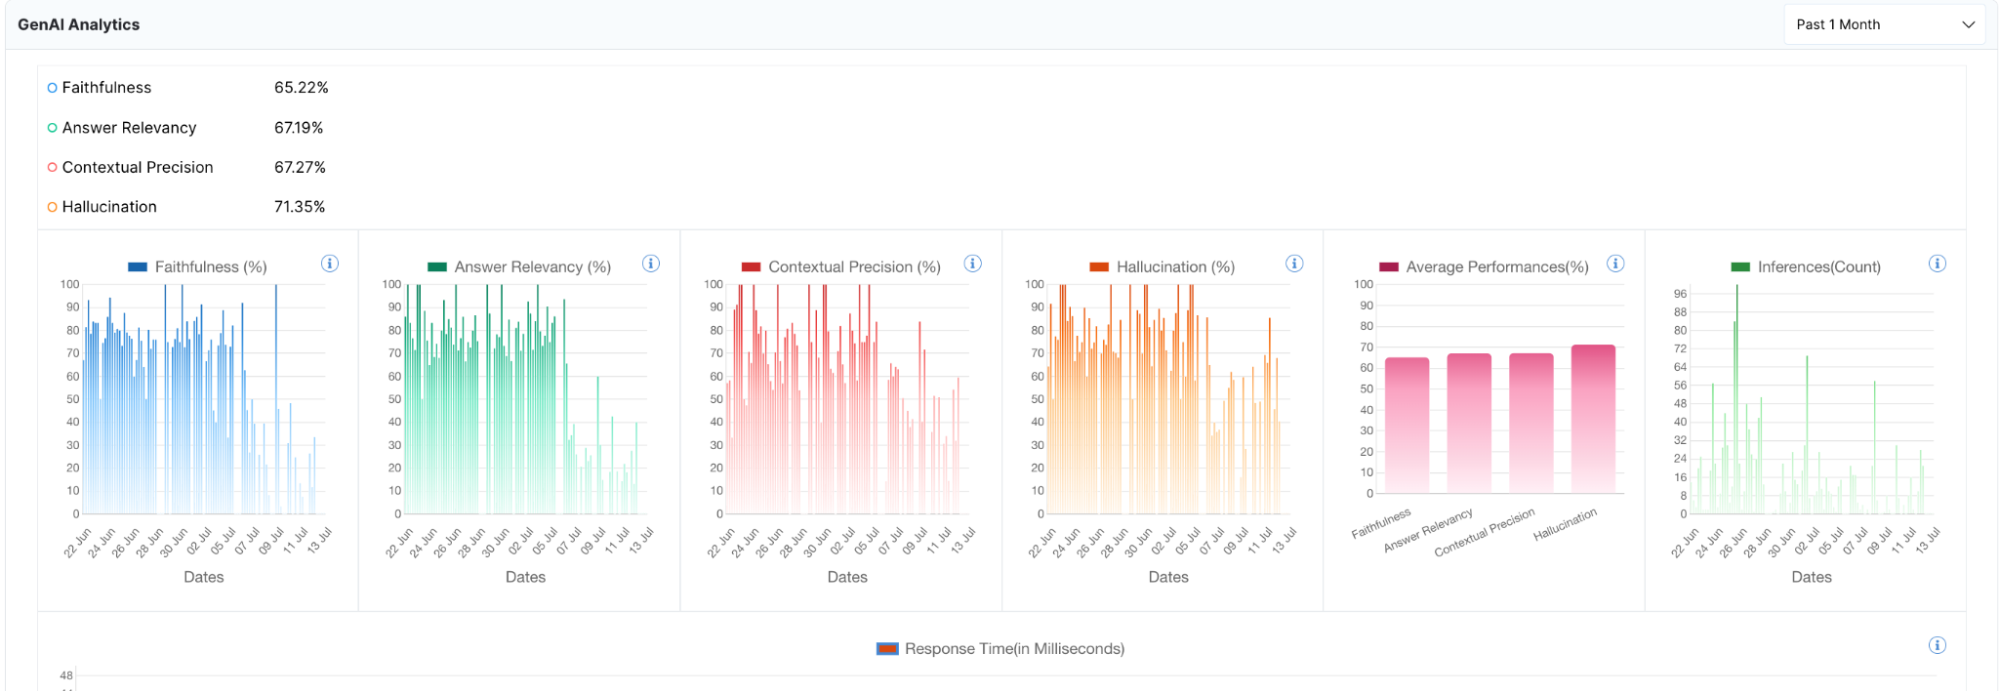
The GenAI Analytics section evaluates the performance of the Generative AI component used in conversations. Each metric is displayed with its current percentage and trend.
Faithfulness: Measures how closely AI-generated responses align with the source data, ensuring factual accuracy.
Answer Relevancy: Evaluates whether the generated response directly answers the user’s query.
Contextual Precision: Assesses the AI’s ability to maintain context across multi-turn conversations.
Hallucination Rate: Tracks the frequency at which the AI produces unsupported or irrelevant information.
A consolidated bar chart summarizes the average performance across these four metrics, providing a quick overview of the generative AI quality.
NLU Engine Queries
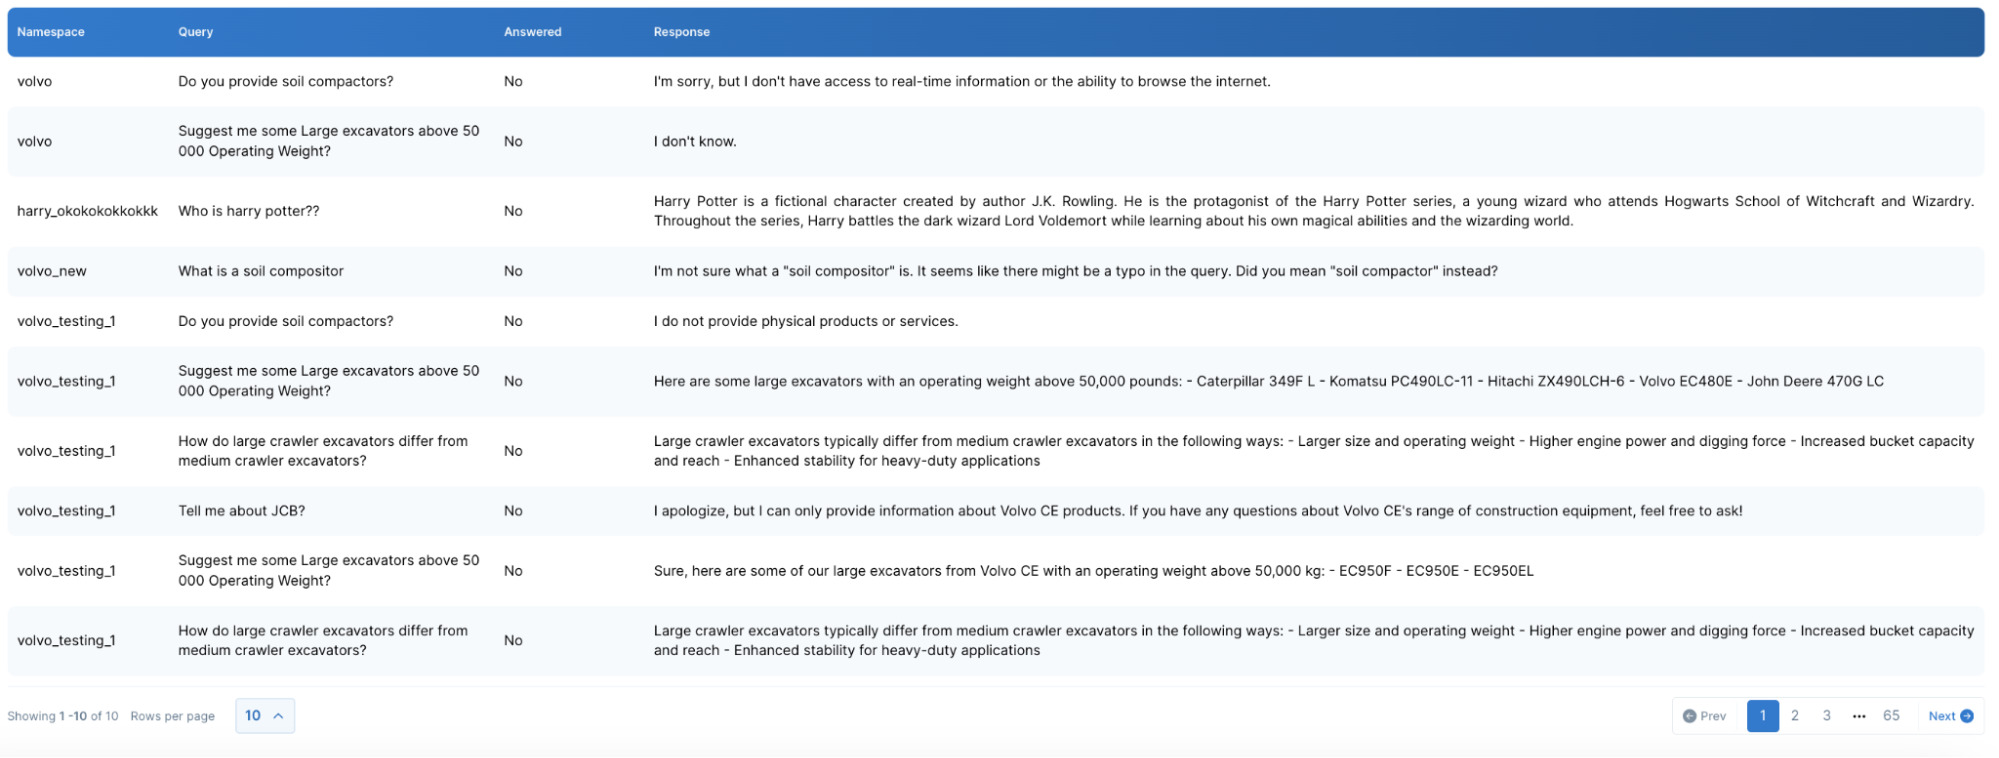
The NLU Engine Queries section provides a detailed log of processed user queries. Each record includes:
Namespace: Indicates the domain or context in which the query was processed (for example, sales or support).
Query: Displays the exact user input received by the NLU engine.
Answered: A Yes/No indicator showing whether the engine successfully generated a valid response.
Response: Shows the AI-generated response for the query, allowing teams to verify accuracy and relevance.
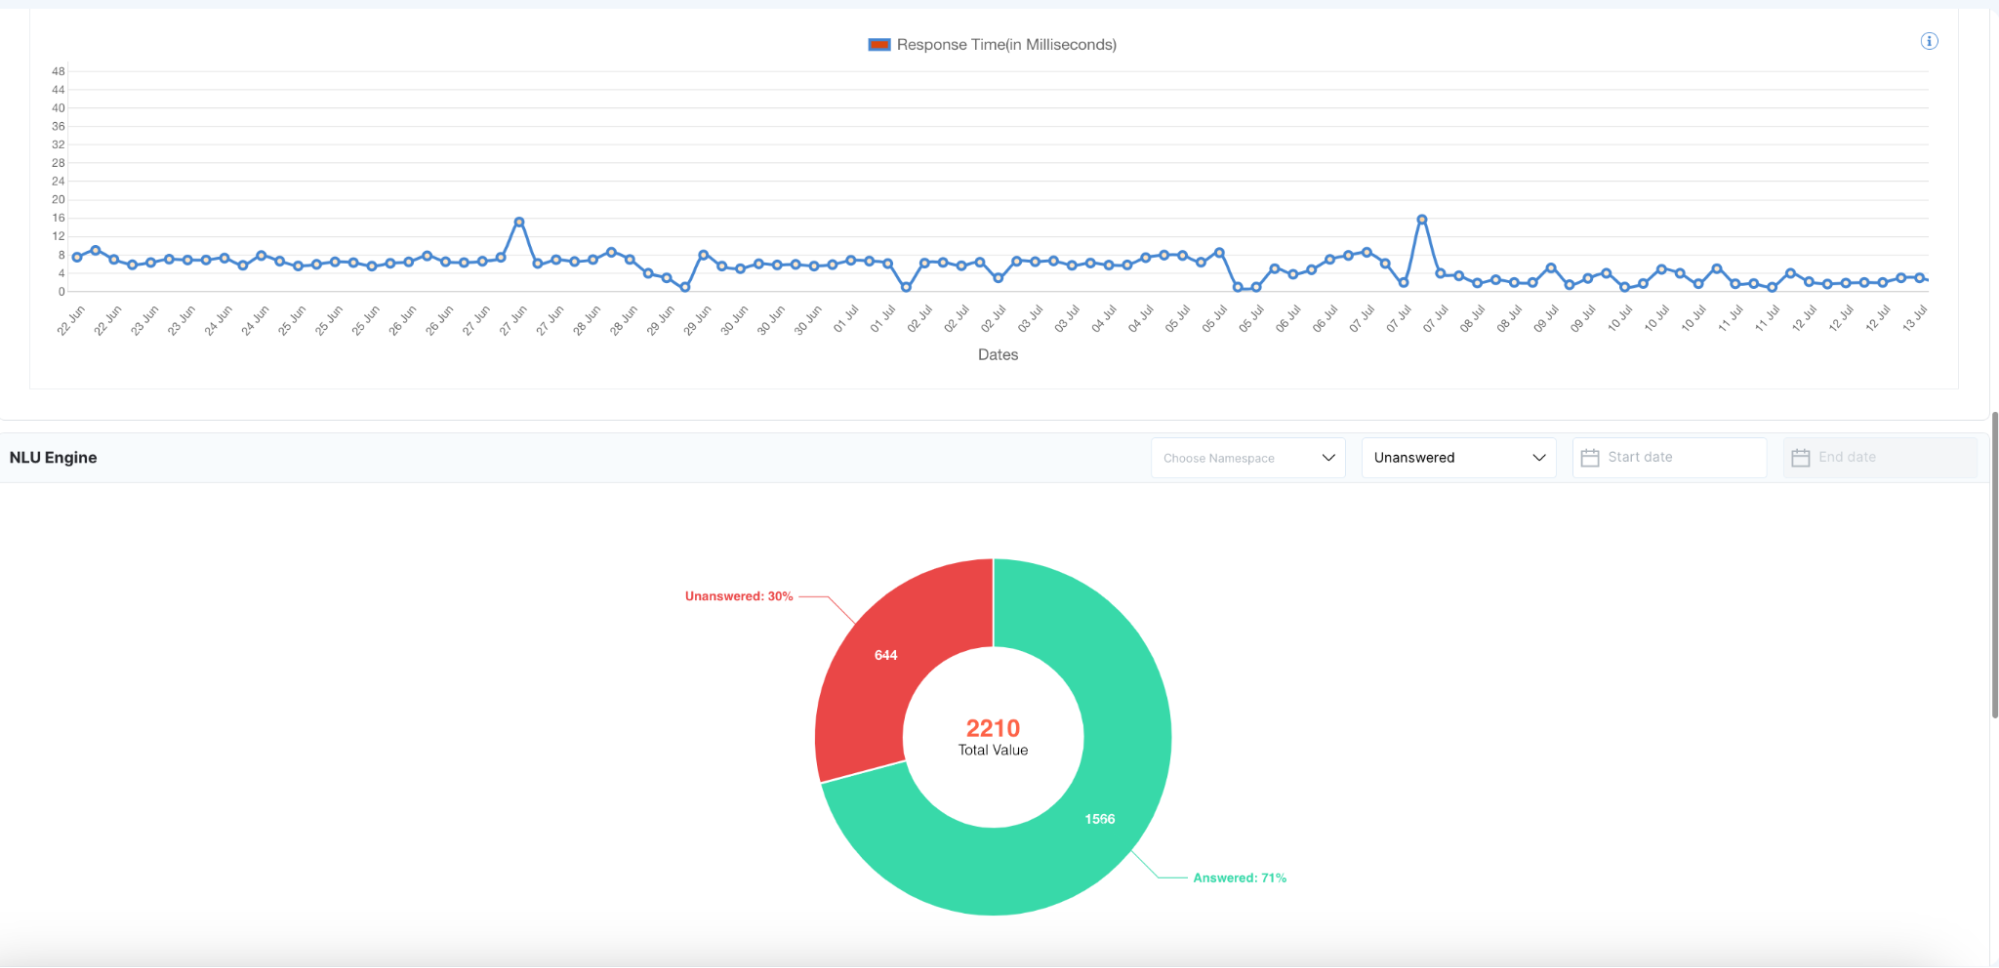
A pie chart summarizes the proportion of answered versus unanswered queries, helping identify gaps in training data or intent coverage.
Additional Metrics
The dashboard also tracks system performance indicators.
Inferences (Count): Shows the total number of inference calls processed by the NLU engine during the selected time period. This helps estimate system usage and workload.
Response Time (ms): Displays the average time taken for the system to process a user query and generate a response, measured in milliseconds.
This metric helps identify potential latency issues in the system.
Controls and Filters
The NLU Engine Analytics dashboard includes several filters and controls to refine analysis.
Date Range Selector: Choose from presets like “Last 7 days” or “Past Month,” or define custom start and end dates to focus your analysis.
Namespace Filter: Filter analytics data for a specific domain or model namespace.
Answer Status Filter: View only answered queries, unanswered queries, or all queries.
Refresh: Reload the dashboard to display the most recent analytics data.
Download: Export tables and charts as CSV files or images for reporting or offline analysis.
Usage Tips
Improve Intent Training: Use the Intent Insights chart to identify low-frequency intents that may require additional training data.
Monitor Intent Behavior: Track the Intent Trends chart for sudden increases or decreases in certain intents, which may indicate evolving user needs.
Optimize Generative AI Quality: Regularly monitor GenAI Analytics metrics to detect rising hallucination rates or declining relevance, and update prompts or retrain models accordingly.
Resolve Coverage Gaps: Review the NLU Engine Queries log to identify frequently unanswered questions and update intent definitions or knowledge sources to handle those queries in the future.