Feedback Analytics
Feedback Analytics provides insights into user sentiment by collecting and analyzing ratings, response rates, and satisfaction scores for both chatbot and agent interactions. This data helps organizations evaluate servic
Feedback Analytics provides insights into user sentiment by collecting and analyzing ratings, response rates, and satisfaction scores for both chatbot and agent interactions. This data helps organizations evaluate service quality, identify areas for improvement, and enhance overall customer satisfaction.
By monitoring feedback trends, teams can better understand user experiences and make informed improvements to support processes.
Access Path
Path: Analytics → Feedback Analytics
To access the Feedback Analytics dashboard:
Navigate to Analytics from the left menu.
Click the Feedback Analytics tab at the top of the page.
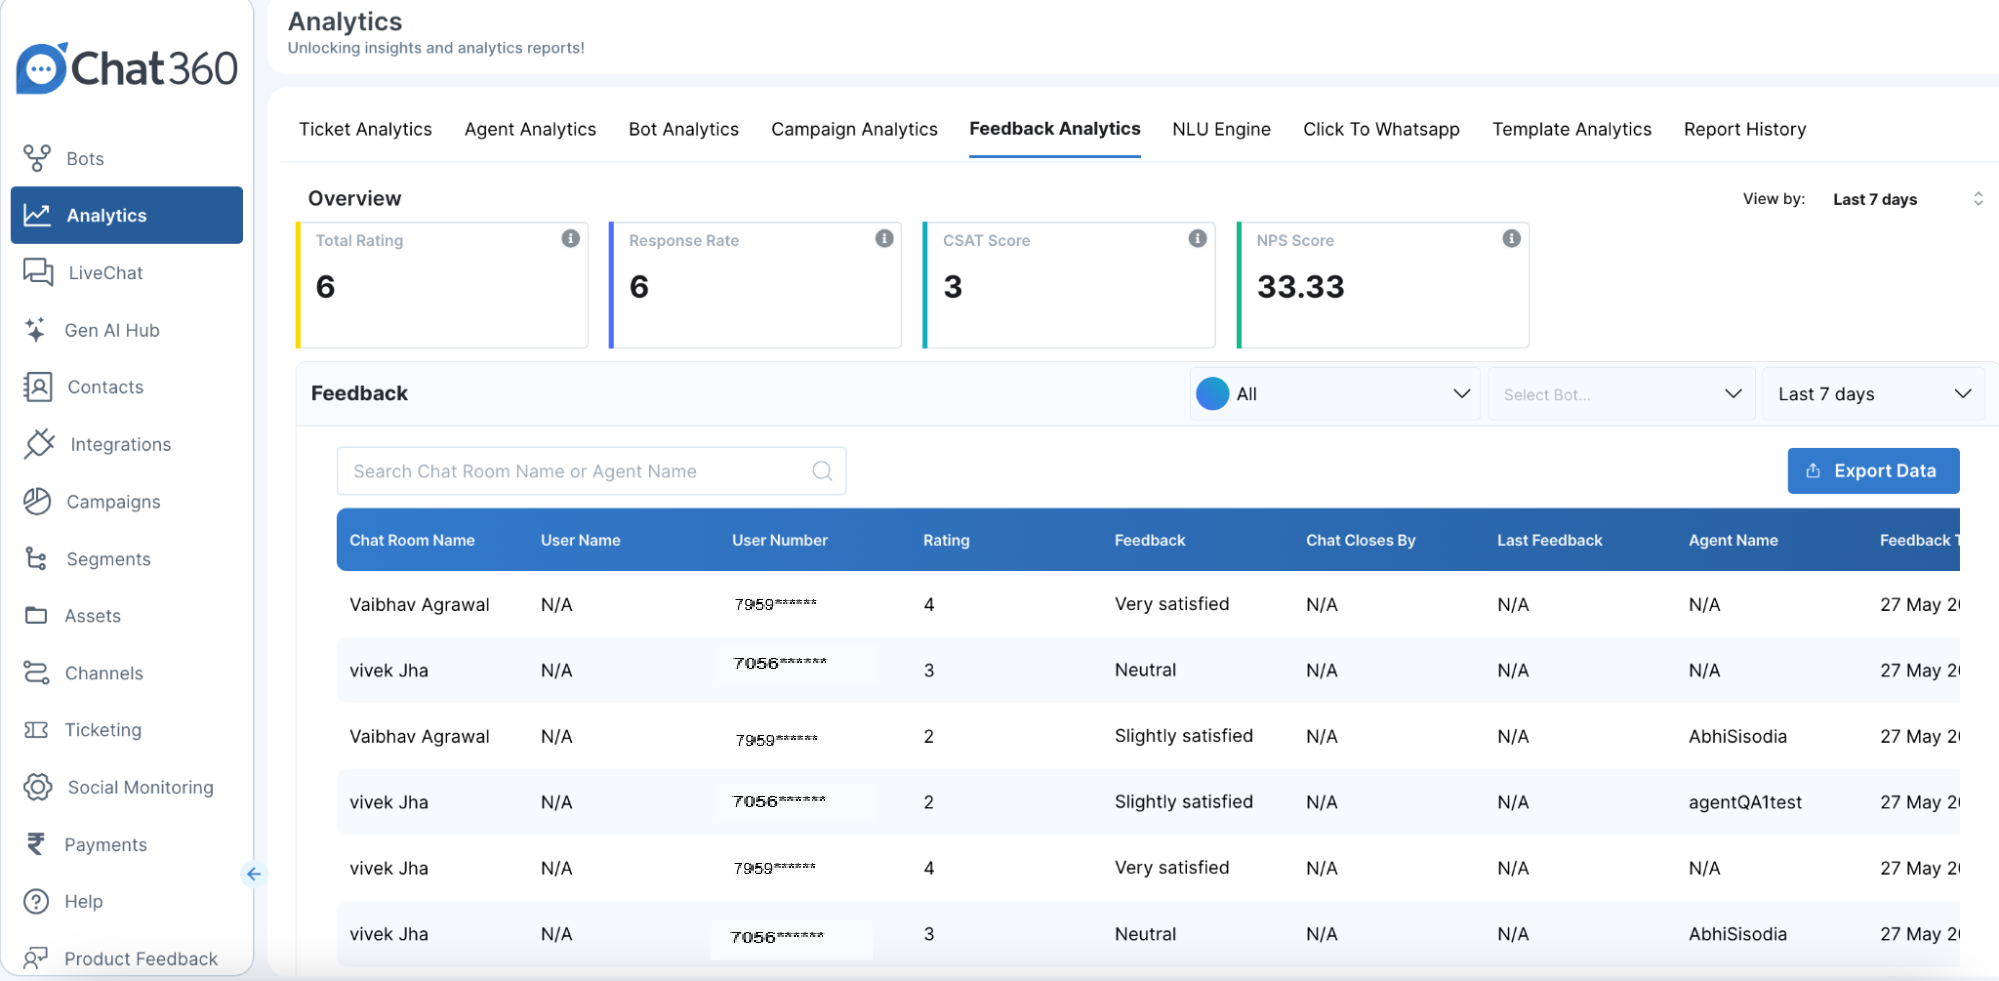
The dashboard will load and display both overall feedback metrics and individual feedback records.
Key Metrics
The dashboard displays several key indicators that help measure customer satisfaction and engagement.
Total Ratings:
Represents the total number of rating values received during the selected time period. This metric provides a quick overview of overall feedback activity.Response Rate:
The percentage of conversations that resulted in users submitting feedback. This indicates how actively users are sharing their opinions about their experience.CSAT Score (Customer Satisfaction Score):
The average satisfaction score provided by users on a 1–5 scale, reflecting immediate satisfaction with the interaction.NPS Score (Net Promoter Score):
Shows the percentage of users who are likely to recommend the service to others, offering insight into overall brand loyalty and customer advocacy.
Feedback List
The dashboard includes a scrollable table displaying individual feedback submissions with the following details:
Chat Room Name: Identifier for the conversation where the feedback was provided.
User Number: The phone number of the user who submitted the feedback.
Rating: The numeric rating given by the user (for example, 1–5).
Feedback Comment: The written feedback provided by the user, such as “Very satisfied” or “Needs improvement.”
Agent Name: The name of the agent or bot that handled the interaction.
Timestamp: The date and time when the feedback was submitted.
Navigation and Controls
The Feedback Analytics dashboard includes several controls to help filter and analyze data.
Time Filter
Select a specific time range, such as:
Last 7 days
Month-to-date
Custom date ranges
Bot Filter: Filter feedback by a specific bot or view feedback across all bots.
Export Data: Download the feedback table as a CSV file for offline analysis or reporting.
Refresh: Reload the dashboard to retrieve the latest feedback data in real time.
Example Use Case
A fintech company analyzes customer feedback after launching a loan application chatbot.
Weekly Feedback Metrics
Total Ratings: 150
CSAT Score: 4.2 / 5
Response Rate: 75% of completed conversations
NPS Score: 45% promoters
During analysis, the team notices that lower ratings (2–3) frequently occur during conversations related to repayment queries. To address this issue, they update the chatbot flow with clearer repayment instructions.
As a result, the CSAT score increases by 8% in the following week.
By regularly reviewing Feedback Analytics, organizations can quickly identify user pain points, reinforce positive experiences, and ensure both chatbots and support agents consistently deliver high-quality customer service.