CTA Tracking Analytics
Track WhatsApp CTA clicks, unique clicks and CTR. Analyze link performance, devices, platforms and click trends to improve message engagement.
CTA Tracking Analytics allows you to monitor how users interact with URLs embedded in WhatsApp message templates. By capturing click activity, this feature provides visibility into which links perform best, the devices used to access them, and the platforms through which users engage.
These insights help teams refine their call-to-action (CTA) strategies and optimize templates to drive higher engagement.
Access Path
To view CTA Tracking Analytics:
Navigate to Analytics in the left menu.
Select Marketing.
Click Template Analytics.
Choose the template you want to analyze.
Click View Details to open the CTA Tracking Dashboard.
Path:
Analytics → Marketing → Template Analytics → Select Template → View Details
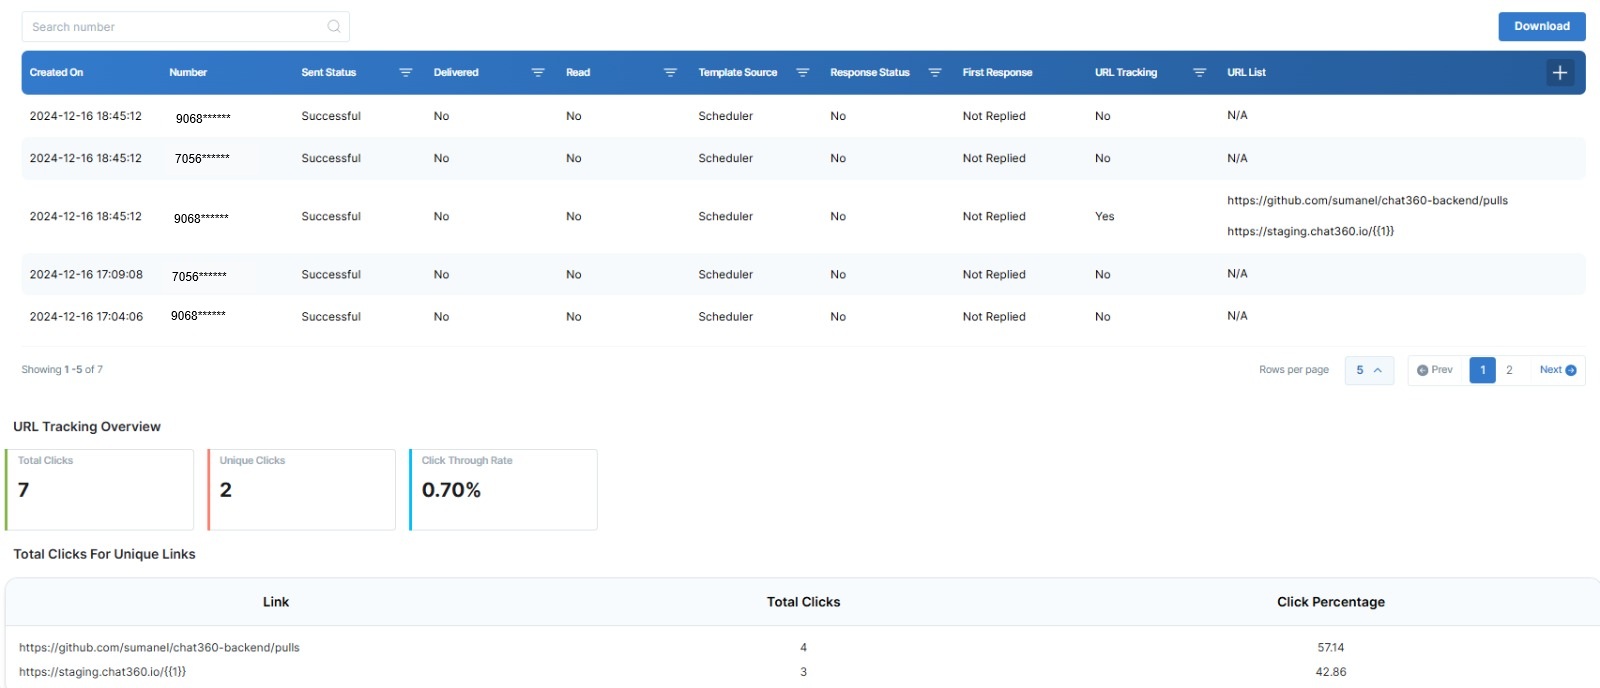
Message Log
At the top of the dashboard, a message log displays a chronological record of each template message sent. The log includes the following details:
Timestamp: Shows the exact date and time when the template message was sent.
Number: Displays the recipient’s phone number.
Sent Status: Indicates whether the message was successfully sent. Scheduled or manually sent messages typically display a Successful status.
Delivered / Read: Shows whether the message was delivered to the recipient’s device and whether it was opened.
URL Tracking: Indicates whether link tracking was enabled for the message.
URL List: Displays the list of tracked URLs included in the template message.
URL Tracking Overview
Below the message log, the dashboard displays key click performance metrics.
Total Clicks: The total number of clicks across all tracked URLs.
Unique Clicks: The number of individual users who clicked at least once on any tracked link.
Click-Through Rate (CTR): Calculated using the formula:
This metric measures how effectively your message drives users to click on embedded links.
Link Performance
Each tracked URL is displayed with detailed performance data.
Link URL: The actual hyperlink included in the template.
Total Clicks: The number of times that specific link was clicked.
Click Percentage:The proportion of clicks attributed to that link compared to the total clicks across all URLs.
This breakdown helps identify which call-to-action links generate the most engagement.
User Environment Insights
The dashboard also provides insights into the environments where clicks occur. These are displayed using visual charts.
Tracking Devices: A pie chart showing the distribution of devices used to access links, such as smartphones or desktops.
Tracking Platforms: Displays the platform through which the link was accessed, such as WhatsApp Mobile or WhatsApp Web.
Tracking Operating Systems (OS): A bar chart highlighting operating systems used by users, such as Android, Linux, or others.
Total Clicks by Date: A bar chart showing the number of clicks recorded over time, helping identify peak engagement days.
Example Use Case
A SaaS company includes two links in a “New Feature Announcement” template:
One link directing users to a blog post
Another link pointing to a product demo video
After sending the template to 1,000 users, the analytics dashboard displays the following results:
Total Clicks: 50
Unique Clicks: 40
Click-Through Rate: 4%
Blog Post: 30 clicks (60%)