Chatbot Metrics
Track chatbot conversations, unique visits, goal completions and conversion rates to uncover performance trends and optimize customer journeys.
The Chatbot Metrics feature provides detailed insights into your bot’s performance by tracking key interaction statistics and presenting them in both tabular and graphical formats. These metrics help you analyze user engagement, evaluate goal completion rates, and identify opportunities to improve your bot’s performance.
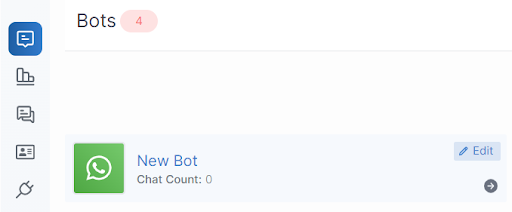
Accessing Chatbot Metrics
Follow these steps to view metrics for a specific bot.
1. Navigate to Your Bot
From the Chat360 dashboard, go to Admin Tools → Bots.
Select the bot for which you want to view metrics.

2. Open the Metrics Dashboard
Click the Bot Metrics button located in the top-right corner of the screen, next to Chatbot Builder.
The Metrics Dashboard will open, displaying a combination of data tables and interactive charts.
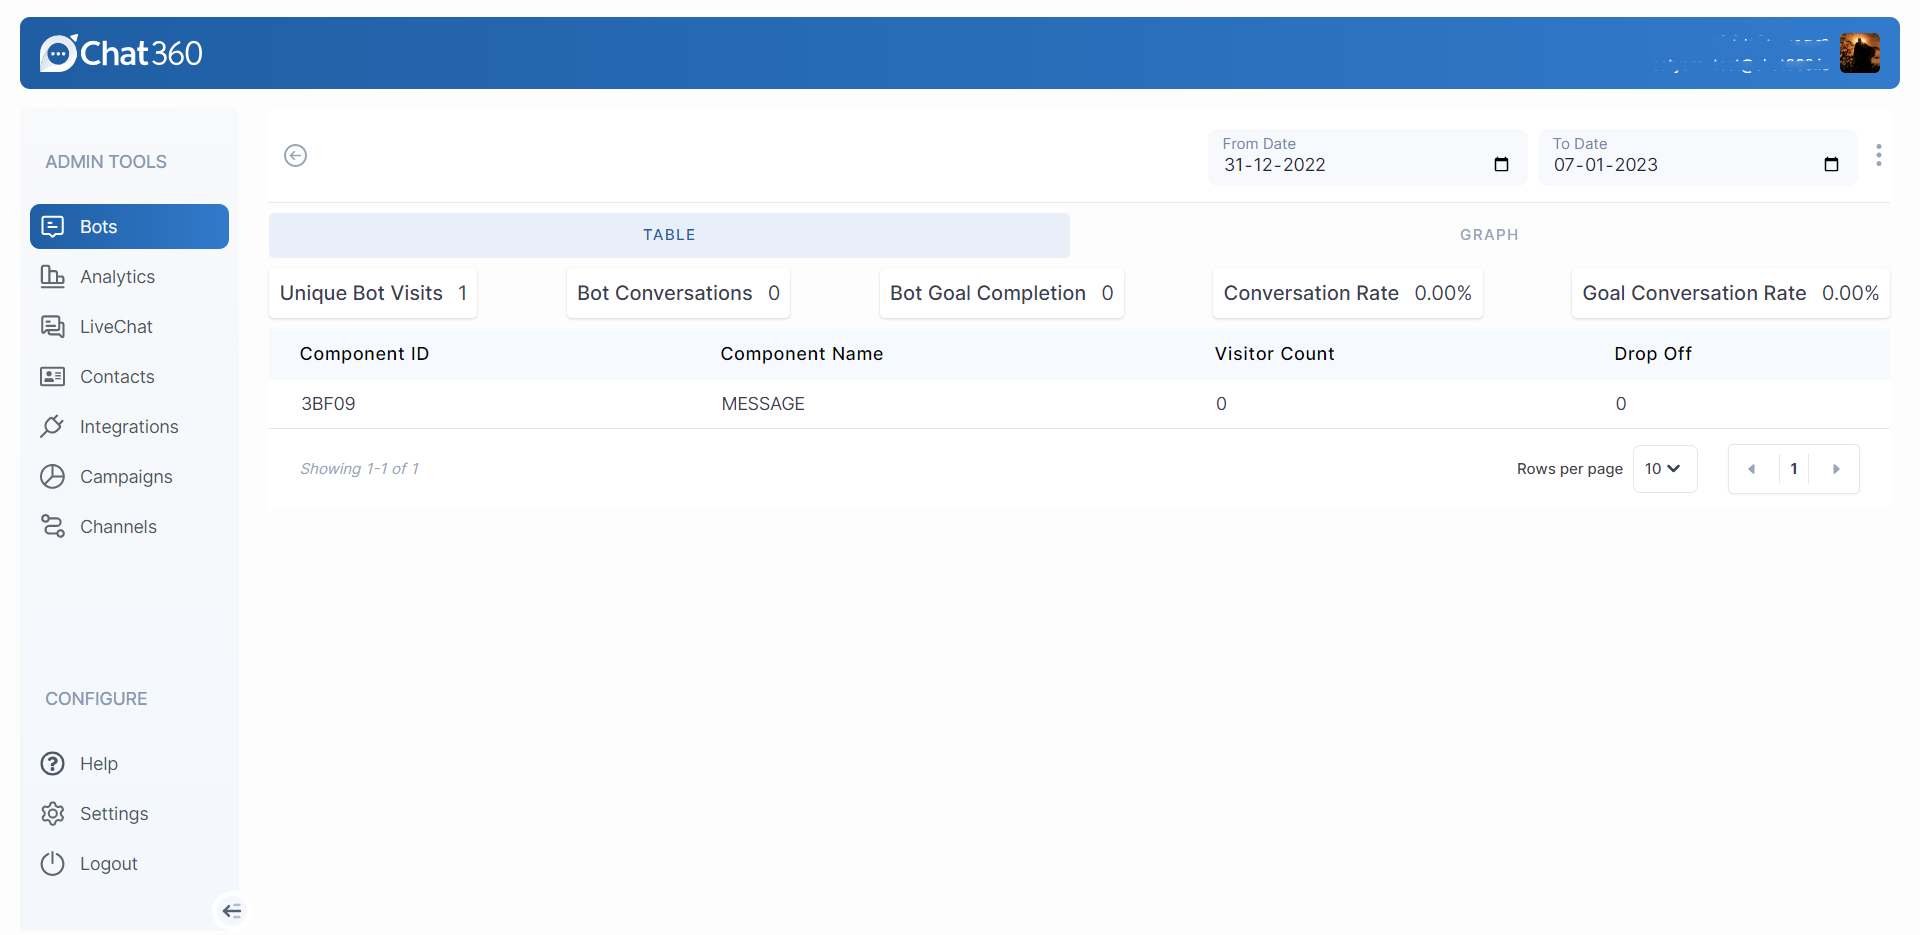
Tabular Metrics
The dashboard includes several key metrics displayed in table format.
Metric | Description |
|---|---|
Unique Bot Visits | Number of unique users who interacted with the bot for the first time. |
Bot Conversations | Total number of chat sessions initiated by users. |
Bot Goal Completions | Number of users who successfully completed predefined goals, such as form submissions or appointment bookings. |
Conversation Rate | Ratio of total conversations to total interactions (such as button clicks or messages sent). |
Goal Conversion Rate | Percentage of conversations that resulted in a completed goal. Calculated as: (Bot Goal Completions ÷ Bot Conversations × 100) |
Note: If no goals are configured for the bot, Bot Goal Completions and Goal Conversion Rate will not display any values.
Graphical Metrics
The metrics dashboard also includes visual charts to help analyze performance trends over time.
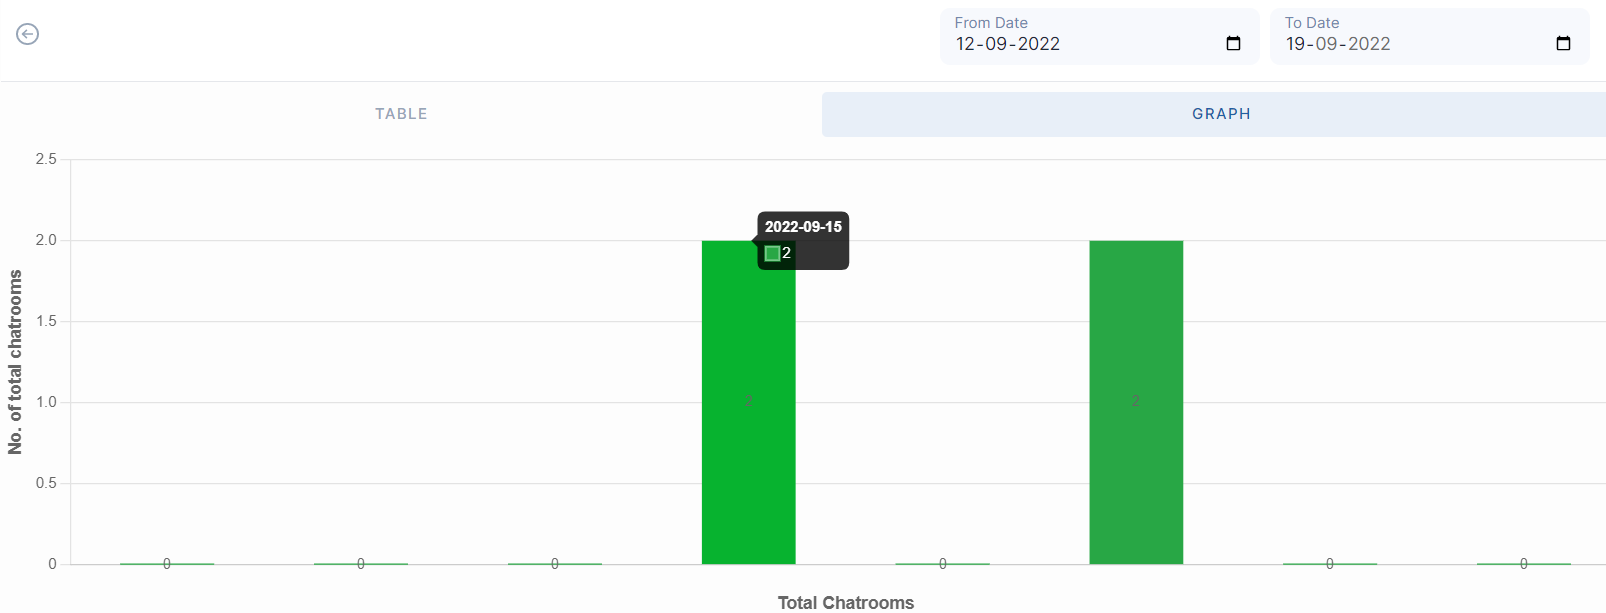
1.Chatrooms vs. Conversations
This chart combines two visual elements:
Bar Graph – Displays the number of chat sessions created each day.
Line Graph – Shows the total number of conversations over the same period.
Hovering over the chart displays the exact date and conversation count for detailed insights.
2.Conversation Trend
A line chart that tracks the number of bot conversations over time.
X-Axis: Date
Y-Axis: Number of conversations
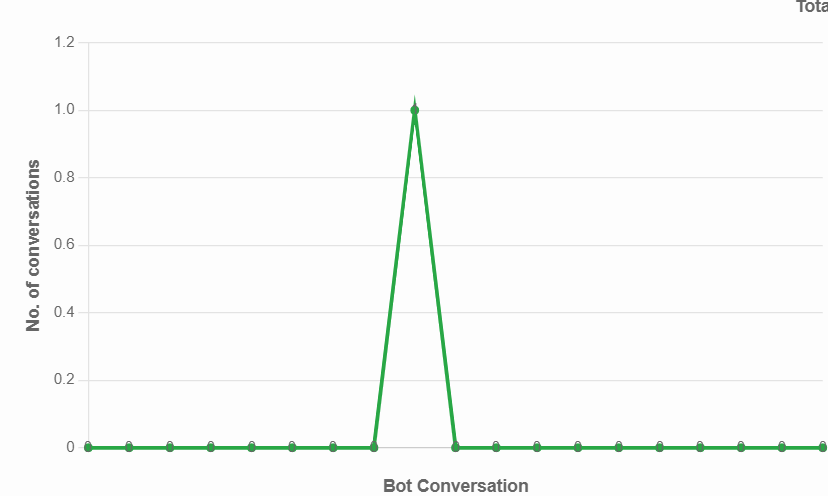
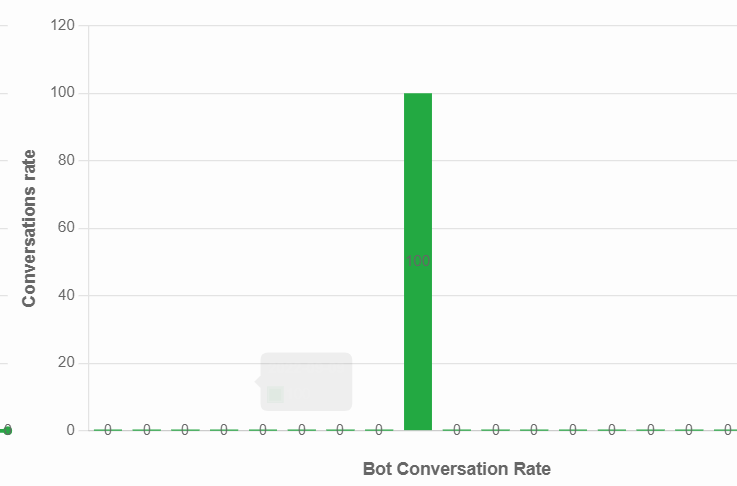
This visualization helps identify usage trends and spikes in user activity.
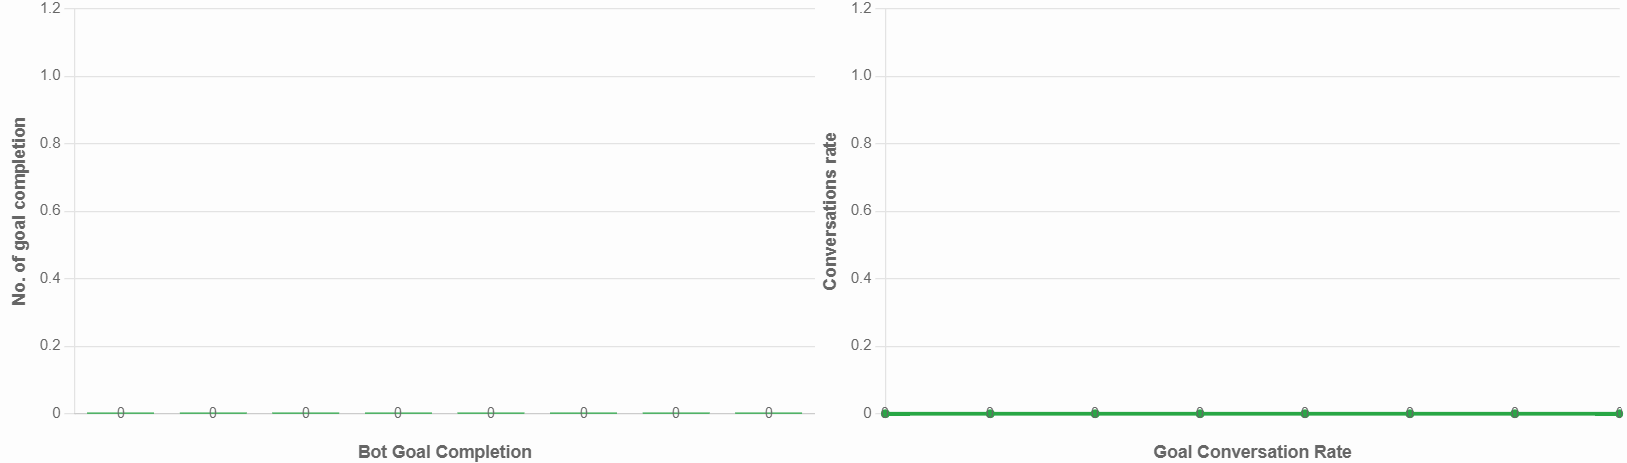
3.Goal Completion Trend
This chart shows how frequently users complete defined bot goals.
Can appear as a line graph or bar graph
X-Axis: Date
Y-Axis: Number of completed goals or conversion rate
This helps measure how effectively the bot drives desired outcomes.
4.Date Range Selection
You can customize the analytics timeframe using the Date Range Toggle. Available options allow you to analyze performance by:
Daily trends
Weekly performance
Monthly summaries
Export Options
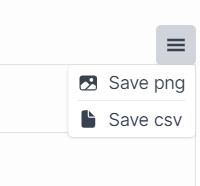
The metrics dashboard supports exporting analytics data for reporting or presentations.
Save Graphs: Download visual charts as image files for use in reports or presentations.
Export Data: Download the dashboard data as a CSV file for offline analysis.
Use Cases
E-Commerce Bot Optimization:
Track conversation spikes during events such as flash sales to ensure the bot can handle increased traffic and improve goal completion rates such as order placements.
Customer Support Improvements:
Measure changes in conversation rates after updating fallback responses or improving bot flow logic to better handle unrecognized queries.
Lead Qualification Analysis:
Evaluate goal conversion rates to determine how effectively the bot captures qualified leads after introducing new qualification questions in the conversation flow.