Bot Analytics
Measure chatbot conversations, goal completion and drop-off rates. Compare bot performance, channels and conversions to optimize customer journeys.
Bot Analytics provides a comprehensive view of your chatbots’ performance across all connected channels. It tracks key metrics such as user engagement, goal completion rates, and conversation drop-offs to help teams evaluate chatbot effectiveness.
By analyzing these insights, organizations can optimize conversational flows, increase goal completions, and quickly identify areas where users may be experiencing friction.
Access Path
To access the Bot Analytics dashboard:
Click Analytics in the left navigation menu.
Select Insights.
Click Bot Analytics.
Path: Analytics → Insights → Bot Analytics
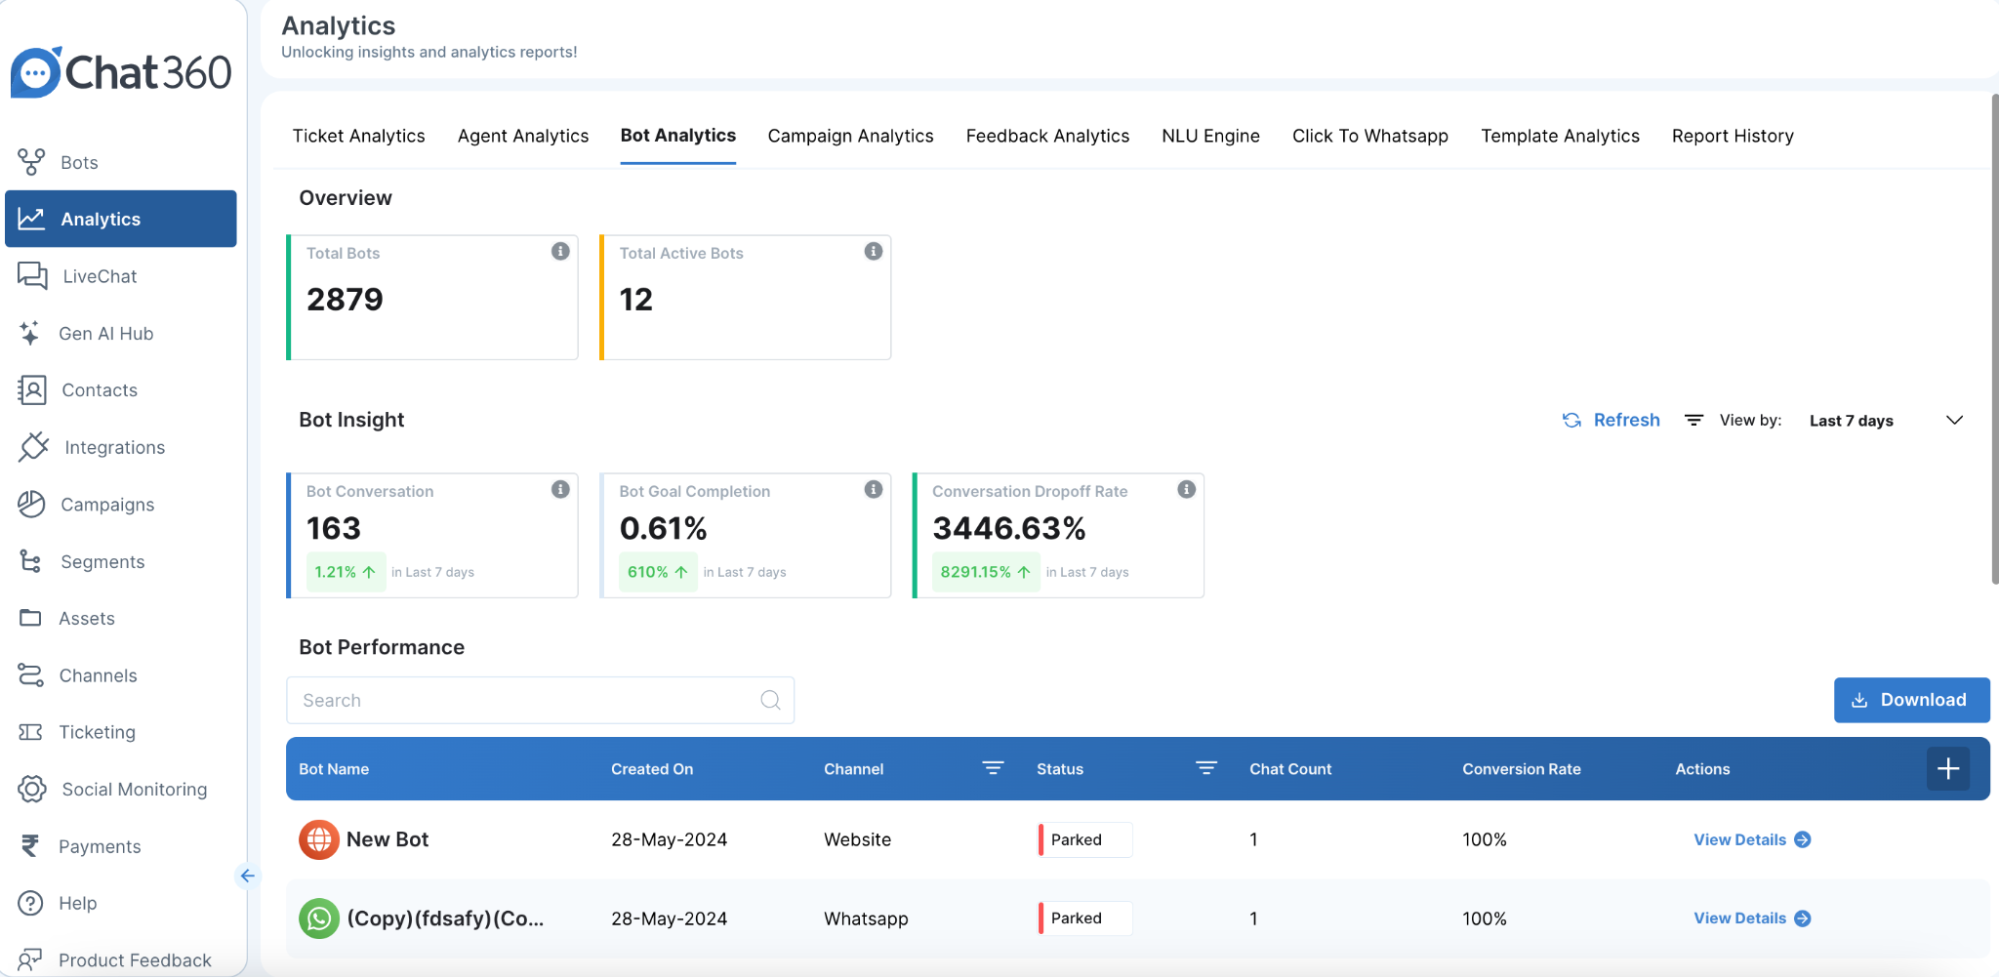
Once opened, the dashboard displays both overall metrics and bot-level performance data.
Global Metrics
The top section of the dashboard shows overall statistics for all configured bots.
Total Bots: Displays the total number of bots created within the account.
Total Active Bots: Indicates how many bots are currently active and available for user interactions.
Engagement Insights
These metrics provide insights into how users interact with your bots.
Bot Conversations: The total number of chat sessions initiated during the selected time period. This metric reflects overall user engagement with the chatbot.
Goal Completion Rate: The percentage of conversations that successfully achieved predefined goals, such as form submissions or appointment bookings. This metric measures the effectiveness of the chatbot in completing intended actions.
Drop-Off Rate: The percentage of sessions where users left the conversation before completing the intended flow. A high drop-off rate may indicate usability or experience issues within the bot journey.
Per-Bot Performance
Below the global metrics, the dashboard displays a table showing performance data for each chatbot.The table includes the following columns:
Bot Name: The name or identifier of the chatbot.
Created On: The date when the bot was created or launched.
Channel: The platform where the bot is deployed, such as WhatsApp, Web, or Facebook.
Status: Indicates whether the bot is currently Active or Inactive.
Chat Count: The total number of conversations handled by the bot.
Conversion Rate: The percentage of conversations that resulted in goal completion.
Actions: Provides quick options to view detailed analytics or download raw data for further analysis.
Navigation and Controls
The Bot Analytics dashboard includes several controls to help refine and analyze data.
Date Filter: Adjust the time window (e.g., last 7 days, month-to-date).
Refresh Data: Reload the dashboard to view the most recent analytics data.
Download: Export the performance table and global metrics as a CSV file for deeper analysis or reporting.
Example Use Case
A retail company runs multiple chatbots across different channels during a promotional campaign.
Bot Setup
Total Bots: 4
Active Bots: 3
Channels: Web, WhatsApp, and Facebook
Weekly Performance
Total Conversations: 1,200
Goal Completion Rate: 48% (users clicked the “Shop Now” call-to-action)
Drop-Off Rate: 22%
After reviewing the analytics, the team discovered that most drop-offs occurred during the payment reminder stage. To improve the experience, they updated the messaging and added a “Need help?” quick-reply option. As a result, the goal completion rate increased to 60% in the following week.
Regularly reviewing Bot Analytics helps teams refine chatbot experiences, reduce user drop-offs, and ensure chatbots effectively support business goals.